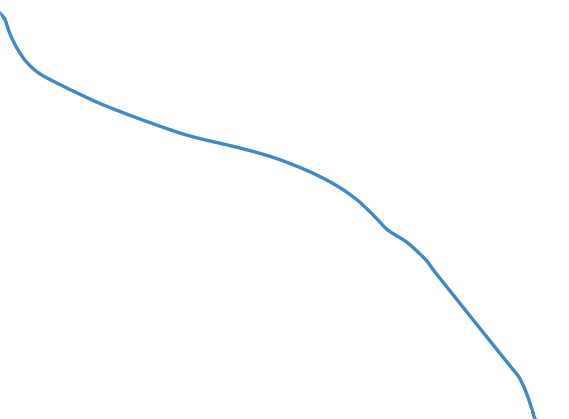
This post describes a simple hack to recover the raw data from a bitmap chart. If you want to cite a line-chart from another document, you often only have access to a low resolution bitmap version of it. Ideally you would like to replot the graph with your own fonts and labels, but the original raw data is not available. In that case this simple technique can help.
Cropping and Cleanup
For this post I use one of the charts from the datasheet of the Duracell Plus Power battery. The easiest way to extract the chart from the PDF-file is to zoom in as much as possible and make a screenshot. Open the screenshot in your favorite graphics editor and crop the chart out of it. Next remove any labels or grid lines by painting them white. The result should look something like this:

Java Code
The following simple Java program counts the number of pixels under the line and calculates the corresponding coordinates of the original data points. The coordinates are written to STDOUT as an array of points in JSON format, which can directly be used with the Rickshaw JS library.
import java.awt.image.BufferedImage;
import java.io.File;
import java.text.DecimalFormat;
import java.text.NumberFormat;
import java.util.Locale;

import javax.imageio.ImageIO;

public class PlotReader {
    private static void usage() {
		System.err.println("Usage: PlotReader <image file> " +
							"<sample rate> <xstart> <xend> " +
							"<ystart> <yend>");
	}

	public static void main(String[] args) {
		if (args.length != 6) {
			System.err.println("Error: Insufficient number of arguments");
			usage();
			return;
		}
		try {
			int sampleRate = Math.max(Integer.parseUnsignedInt(args[1]), 1);
			double xstart = Double.parseDouble(args[2]);
			double xend = Double.parseDouble(args[3]);
			double ystart = Double.parseDouble(args[4]);
			double yend = Double.parseDouble(args[5]);

			BufferedImage image = ImageIO.read(new File(args[0]));
			DecimalFormat df = (DecimalFormat)
					NumberFormat.getNumberInstance(Locale.ENGLISH);
			df.applyPattern("#.###");

			System.out.print("[");

			for (int x = 0; x < image.getWidth(); x += sampleRate) {
				for (int y = image.getHeight() - 1; y >= 0 ; --y) {
					int rgb = image.getRGB(x, y);
					int r = rgb & 0xFF;
					int g = (rgb >> 8) & 0xFF;
					int b = (rgb >> 16) & 0xFF;

					if (r < 245 || g < 245 || b < 245) {
						// not white
						int realY = image.getHeight() - 1 - y;
						double yout = (yend - ystart) / image.getHeight() *
										realY + ystart;
						double xout = (xend - xstart) / image.getWidth() *
										x + xstart;

						if (x > 0) {
							System.out.println(",");
						}
						System.out.print("{ \"x\": " + df.format(xout) +
										", \"y\": " + df.format(yout) + " }");
						break;
					}
				}
			}

			System.out.println("]");
		} catch(Exception e) {
			System.err.println("Error: " + e.getMessage());
			usage();
		}
	}
}
Example
Save the Java code to a file named PlotReader.java and compile it with the following command:
$ javac PlotReader.javaThen execute it with the following parameters:
$ java PlotReader <image file> <sample rate> <xstart> <xend> <ystart> <yend>- Image File
- The path to the image file we created earlier.
- Sample Rate
- The number of pixels that are skipped along the X-axis for every iteration. If this value is 1 then every pixel is sampled. If this value is 5 then only every fifth pixel is used.
- X Start
- The value where the X-axis starts in the original chart (usually 0)
- X End
- The value where the X-axis ends in the original chart
- Y Start
- The value where the Y-axis starts in the original chart (usually 0)
- Y End
- The value where the Y-axis ends in the original chart
The following example should illustrate the usage. You should tweak the sample rate according to the resolution of the image and the number of points you want to create.
$ java PlotReader 5mA.png 10 0 700 0.8 1.6
[{ "x": 0, "y": 1.569 },
{ "x": 12.302, "y": 1.524 },
{ "x": 24.605, "y": 1.489 },
{ "x": 36.907, "y": 1.468 },
{ "x": 49.209, "y": 1.453 },
{ "x": 61.511, "y": 1.443 },
{ "x": 73.814, "y": 1.434 },
{ "x": 86.116, "y": 1.424 },
{ "x": 98.418, "y": 1.415 },
...
Replotted Interactive Result
The following interactive chart was created from data extracted from the Duracell Plus Power datasheet.
References
- Duracell Plus Power AA Datasheet - http://media.professional.duracell.com/downloads/datasheets/product/Plus%20Power/Plus_AA_MN1500.pdf
- Rickshaw JS library - http://code.shutterstock.com/rickshaw/